
In response to the 2020 Covid-19 pandemic, numerous interactive charts, graphs and maps have been created to track and analyse the spread of the virus in time and space. In the three Baltic states, data visualisation dashboards have been produced by the Latvian Centre for Disease Prevention and Lithuania’s Statistics Department, as well as Estonia’s Corona Map prototyped during the ‘Hack the Crisis’ Garage48 Hackathon. While these Covid-19 graphs and maps have become a familiar sight to us over the past couple of months, medical data visualisations have a much longer history in the Baltic region.
Medical or sanitary maps as a particular genre of thematic cartography have been around since the late 18th century, yet they gained popularity in the first half of the nineteenth century as tools to analyse medical data, identify factors impacting the spread of contagious diseases, and communicate these findings to wider audiences. One of the most famous examples came out of London in the 1850s. British epidemiologist John Snow published several ground-breaking studies linking water contamination to the spread of cholera, a conclusion reached precisely through the process of mapping clusters of cases, which Snow was then able to trace to a contaminated water pump.1
In the Russian Empire’s Baltic provinces statisticians and medical professionals were similarly experimenting with using visual methods to investigate the spread of disease.2 What follows is a brief tour through some historical examples of graphs and maps made to record disease outbreaks in 19th-century Livland province (present-day southern Estonia and northern Latvia). These examples relay alternate histories of medical data visualisation in the Baltic region and help us to think about the current explosion of Covid-19 graphs and maps as part of a much broader history of data visualisation in Baltic society.
Cholera epidemics swept across vast swathes of the globe in the 19th century, with the disease spreading to Livland province in waves in 1831, 1848, 1866, 1871, and 1892. City health officials carefully followed the spread of the disease. During the outbreak, the numbers of new cases and deaths was printed daily in local newspapers. In subsequent months, physicians and scientists published more detailed studies that attempt to analyse bigger trends and patterns in the epidemic’s trajectory. The majority of these medical reports and data visualisations from the imperial period are in German, the dominant language used by medical professionals in the Baltic region during this time.
‘Flattening the curve’ has become one of the key slogans of the Covid-19 pandemic, as part of a public health campaign to encourage compliance with measures aimed at slowing the rate of transmission, such as social distancing and wearing masks. In the 19th century, medical professionals were likewise obsessed with tracking the ‘curve’ of cholera outbreaks. The newly emerging fields of medical statistics and data visualisation gained considerable attention as a way to track the peak and gradual reduction in new cases.
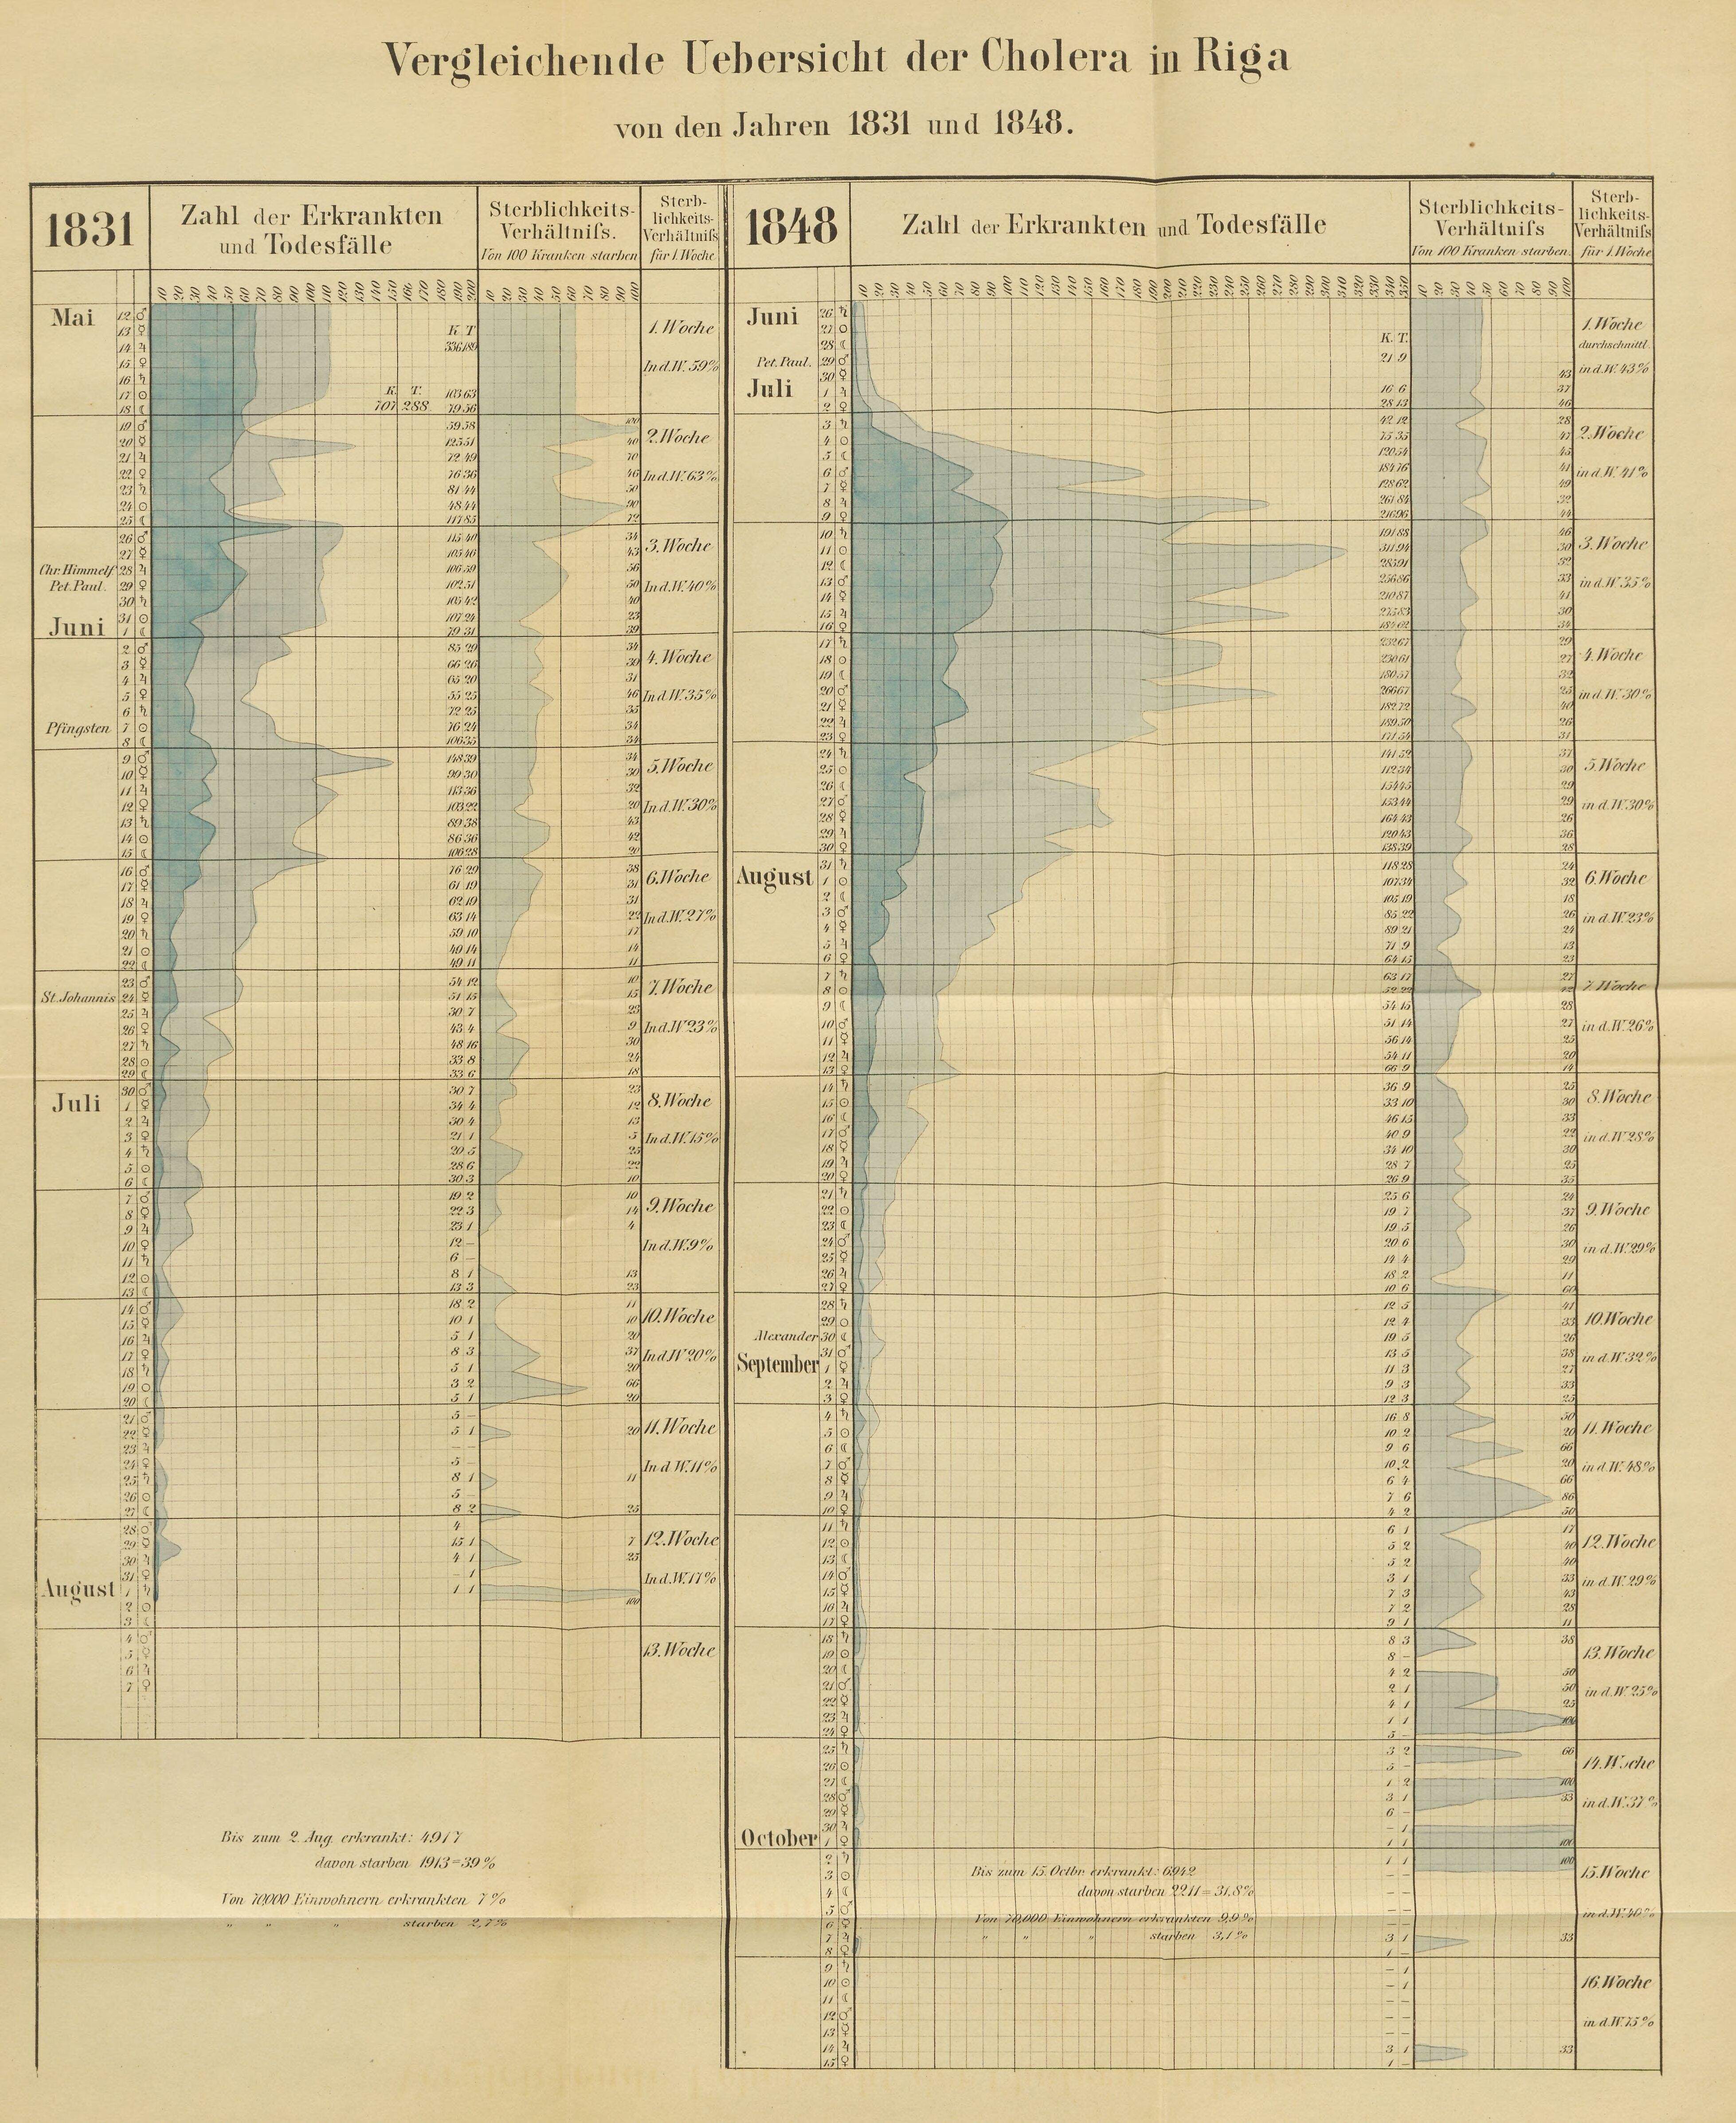
Taking a close look at these cholera studies reveals how scientists and medical professionals used data visualisations to search for causal relationships with environmental factors that might have contributed to the pandemic. For instance, in 1849 a group of doctors from the Society of Practical Physicians published a report on the 1848 cholera pandemic in Riga. The study discussed symptoms, treatments, and included a chart comparing the daily number of cases, deaths, and morality rates in 1848 with the previous outbreak in 1831.
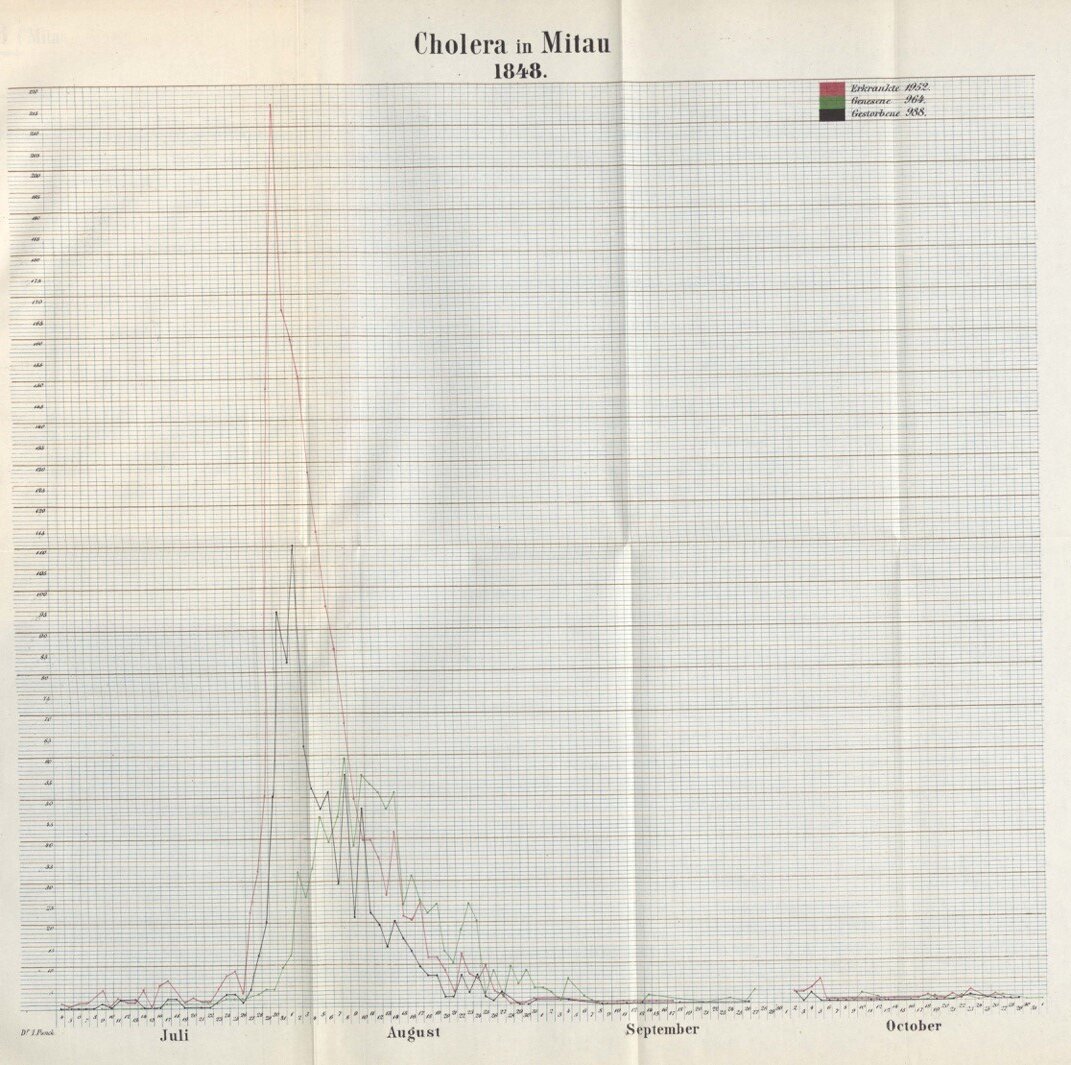
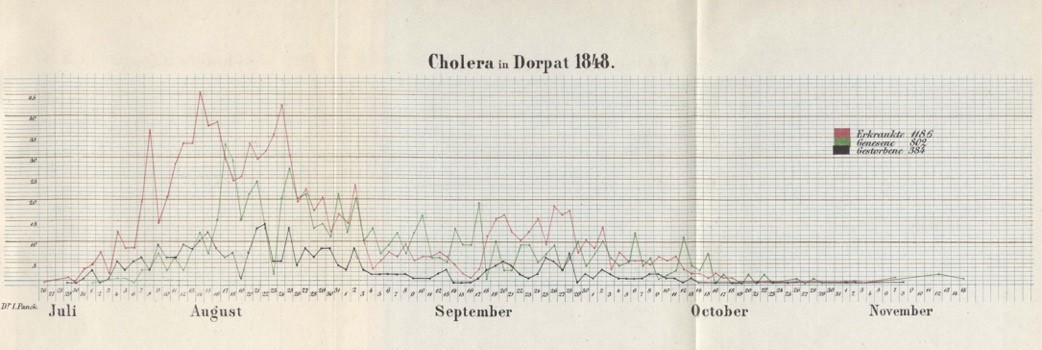
The following year, Carl Heinrich Schmidt, Professor of Pharmacy at Dorpat University, published a comparative analysis of the impact of the 1848 pandemic in the three main cities across Livland and Kurland province: Riga, Mitau (Jelgava), and Dorpat (Tartu).
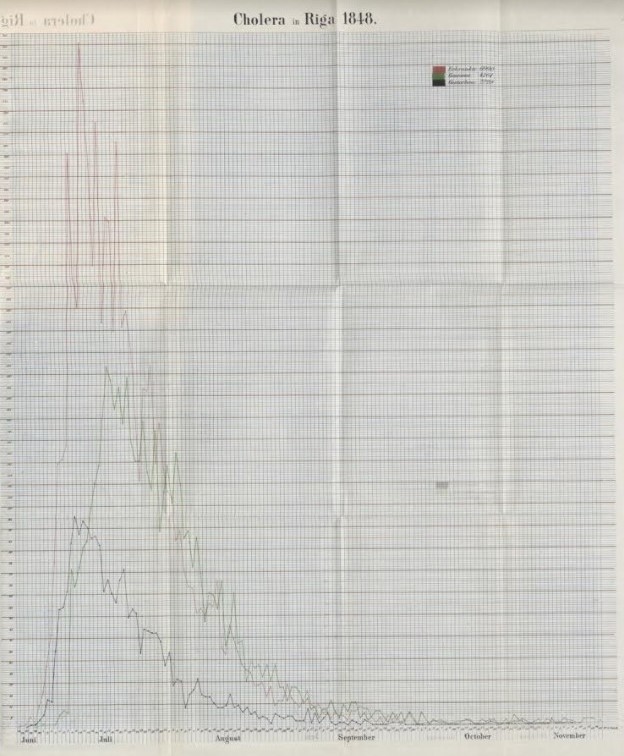
He produced graphs for all three cities tracking daily infections, recoveries, and deaths. A chemist by training, Schmidt was interested in the role of environmental factors, such as weather, temperature, and air pressure, on the infection trajectories in different cities.
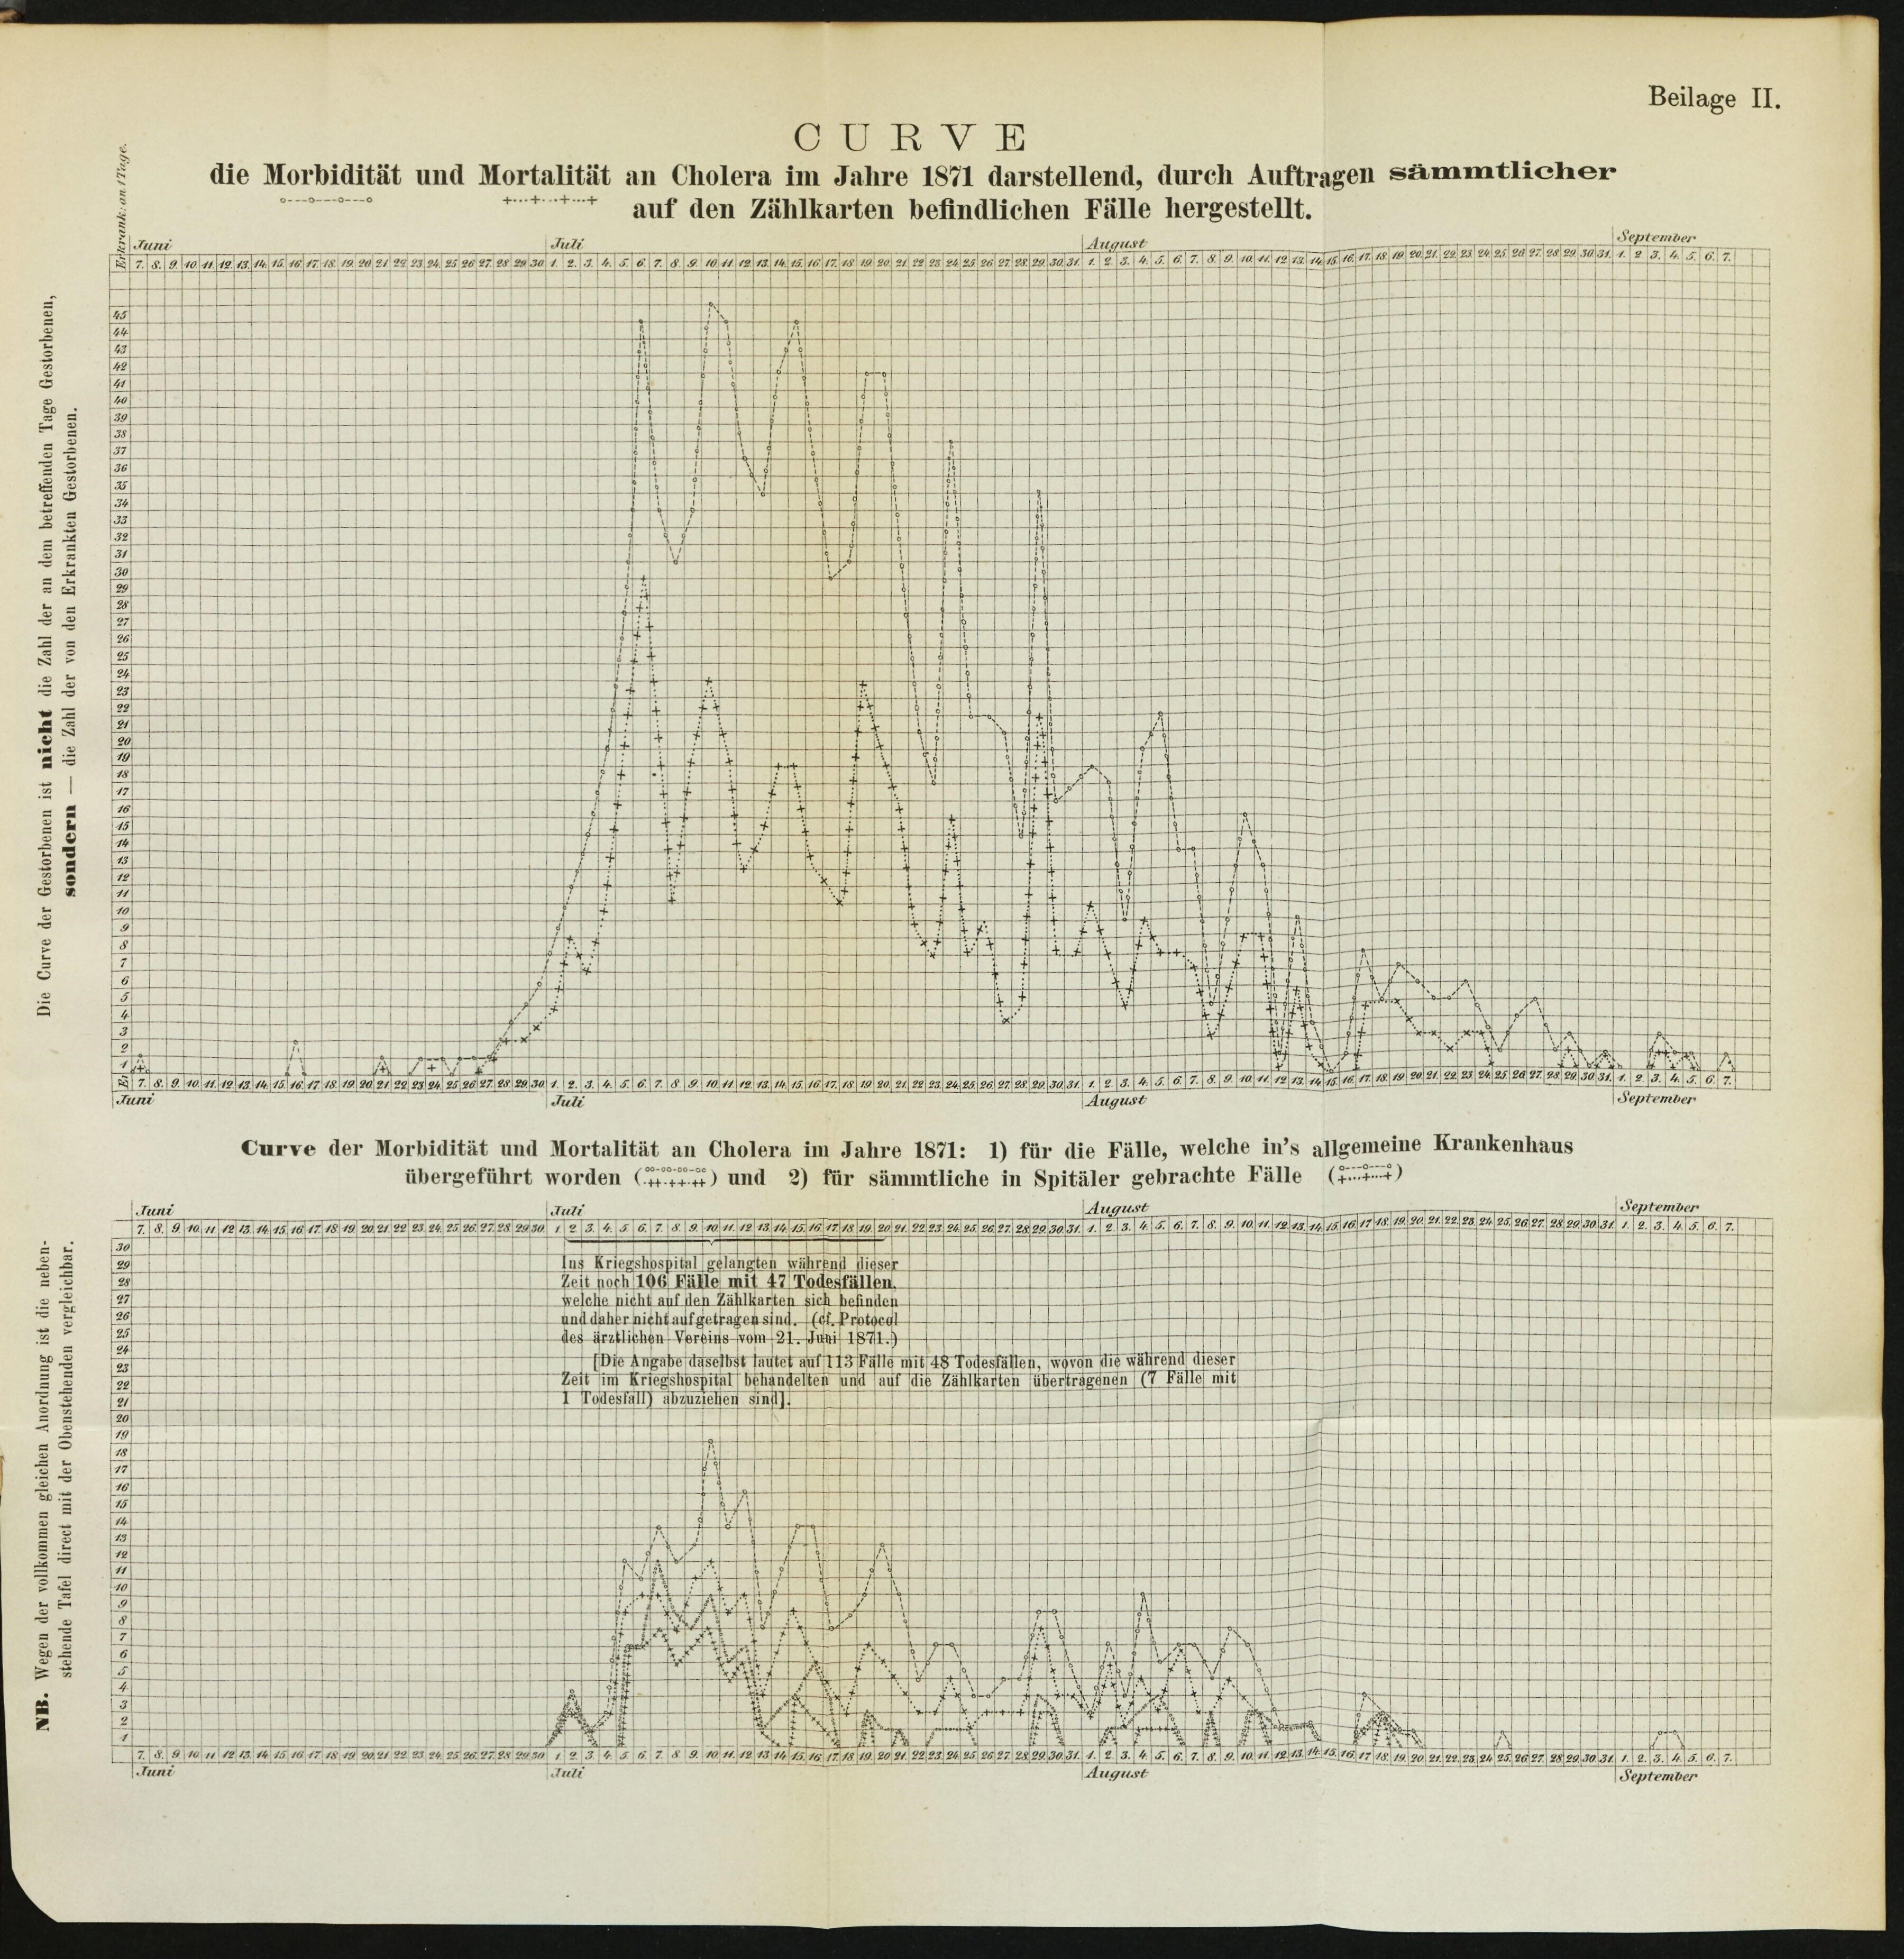
Another example from 1886, published by the Riga Sanitation Commission, included detailed graphs comparing the number of cases and deaths in the 1871 outbreak with those in 1831 and 1848. The author, physician Carl M. Schmidt (note – a different Carl Schmidt to the example above!), was especially interested in infection rates in hospitals and whether hospitalised patients had a higher mortality rate.
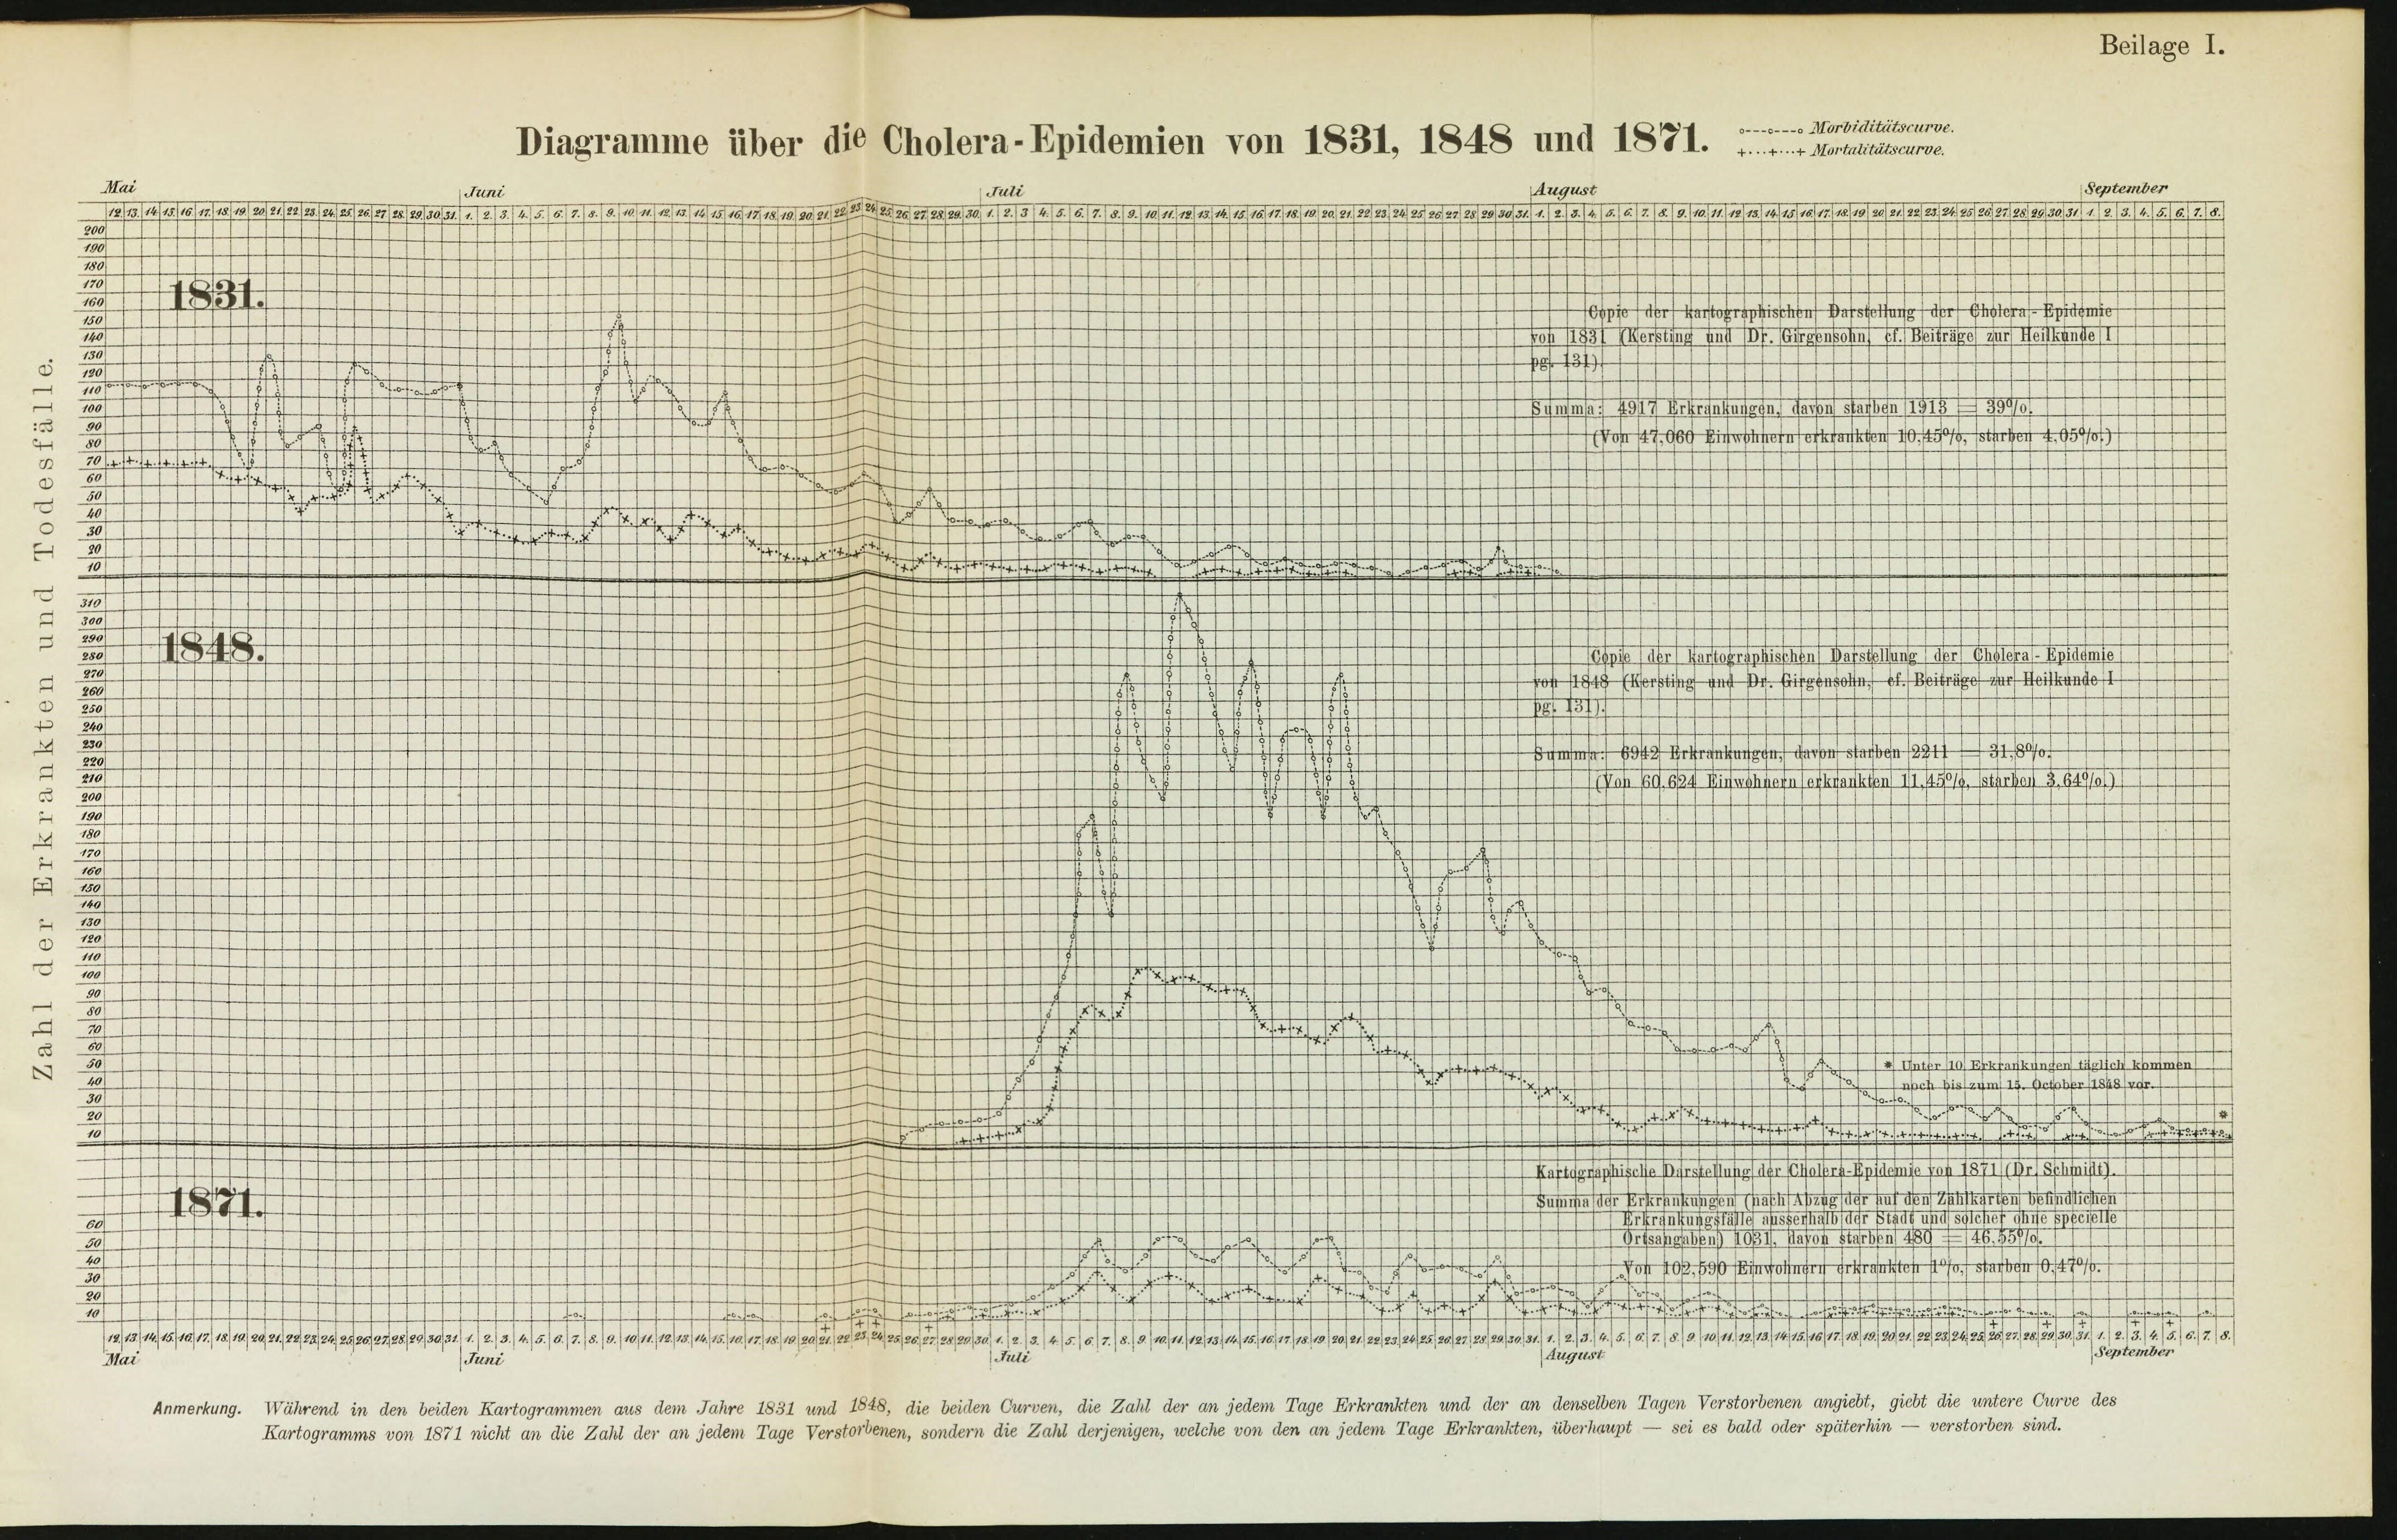
All these cholera data visualisations were accompanied by detailed notes explaining to readers how to process and interpret the information displayed in these graphic communications. For instance, accompanying the graphs in Carl M. Schmidt’s study of Riga’s cholera ‘curve’ in 1871 was an explanatory note clarifying that the reported deaths were not the number of the people who died on the day in question, but those who had fallen ill and died from cholera. These commentaries to the charts and graphs reveal how medical data visualisation was emerging not only as a means of research and investigation, but also as a tool of communication. Within the relatively new and emerging field of medical data visualisation, these practitioners took steps to educate their fellow readers in data literacy to make sure that the meaning of the data would be interpreted correctly.
By the 1870s Riga was undergoing rapid industrialisation and massive population growth due to rural to urban migration. Cholera spread fast in overcrowded housing conditions with poor sanitation. As historian Charlotte E. Henze notes, ‘Cholera is indeed the classic epidemic disease of Europe’s age of industrialisation and urbanisation.’8
The link between housing conditions and the spread of contagious diseases was clear to 19th-century medical professionals, who saw Riga’s urban geography as providing clues to the links between environmental conditions, social inequalities, and public health. Schmidt’s study from 1886 included an appended map of cholera cases in Riga, made using data from nine maps produced weekly by the Riga Sanitation Commission at the time of the outbreak itself.9
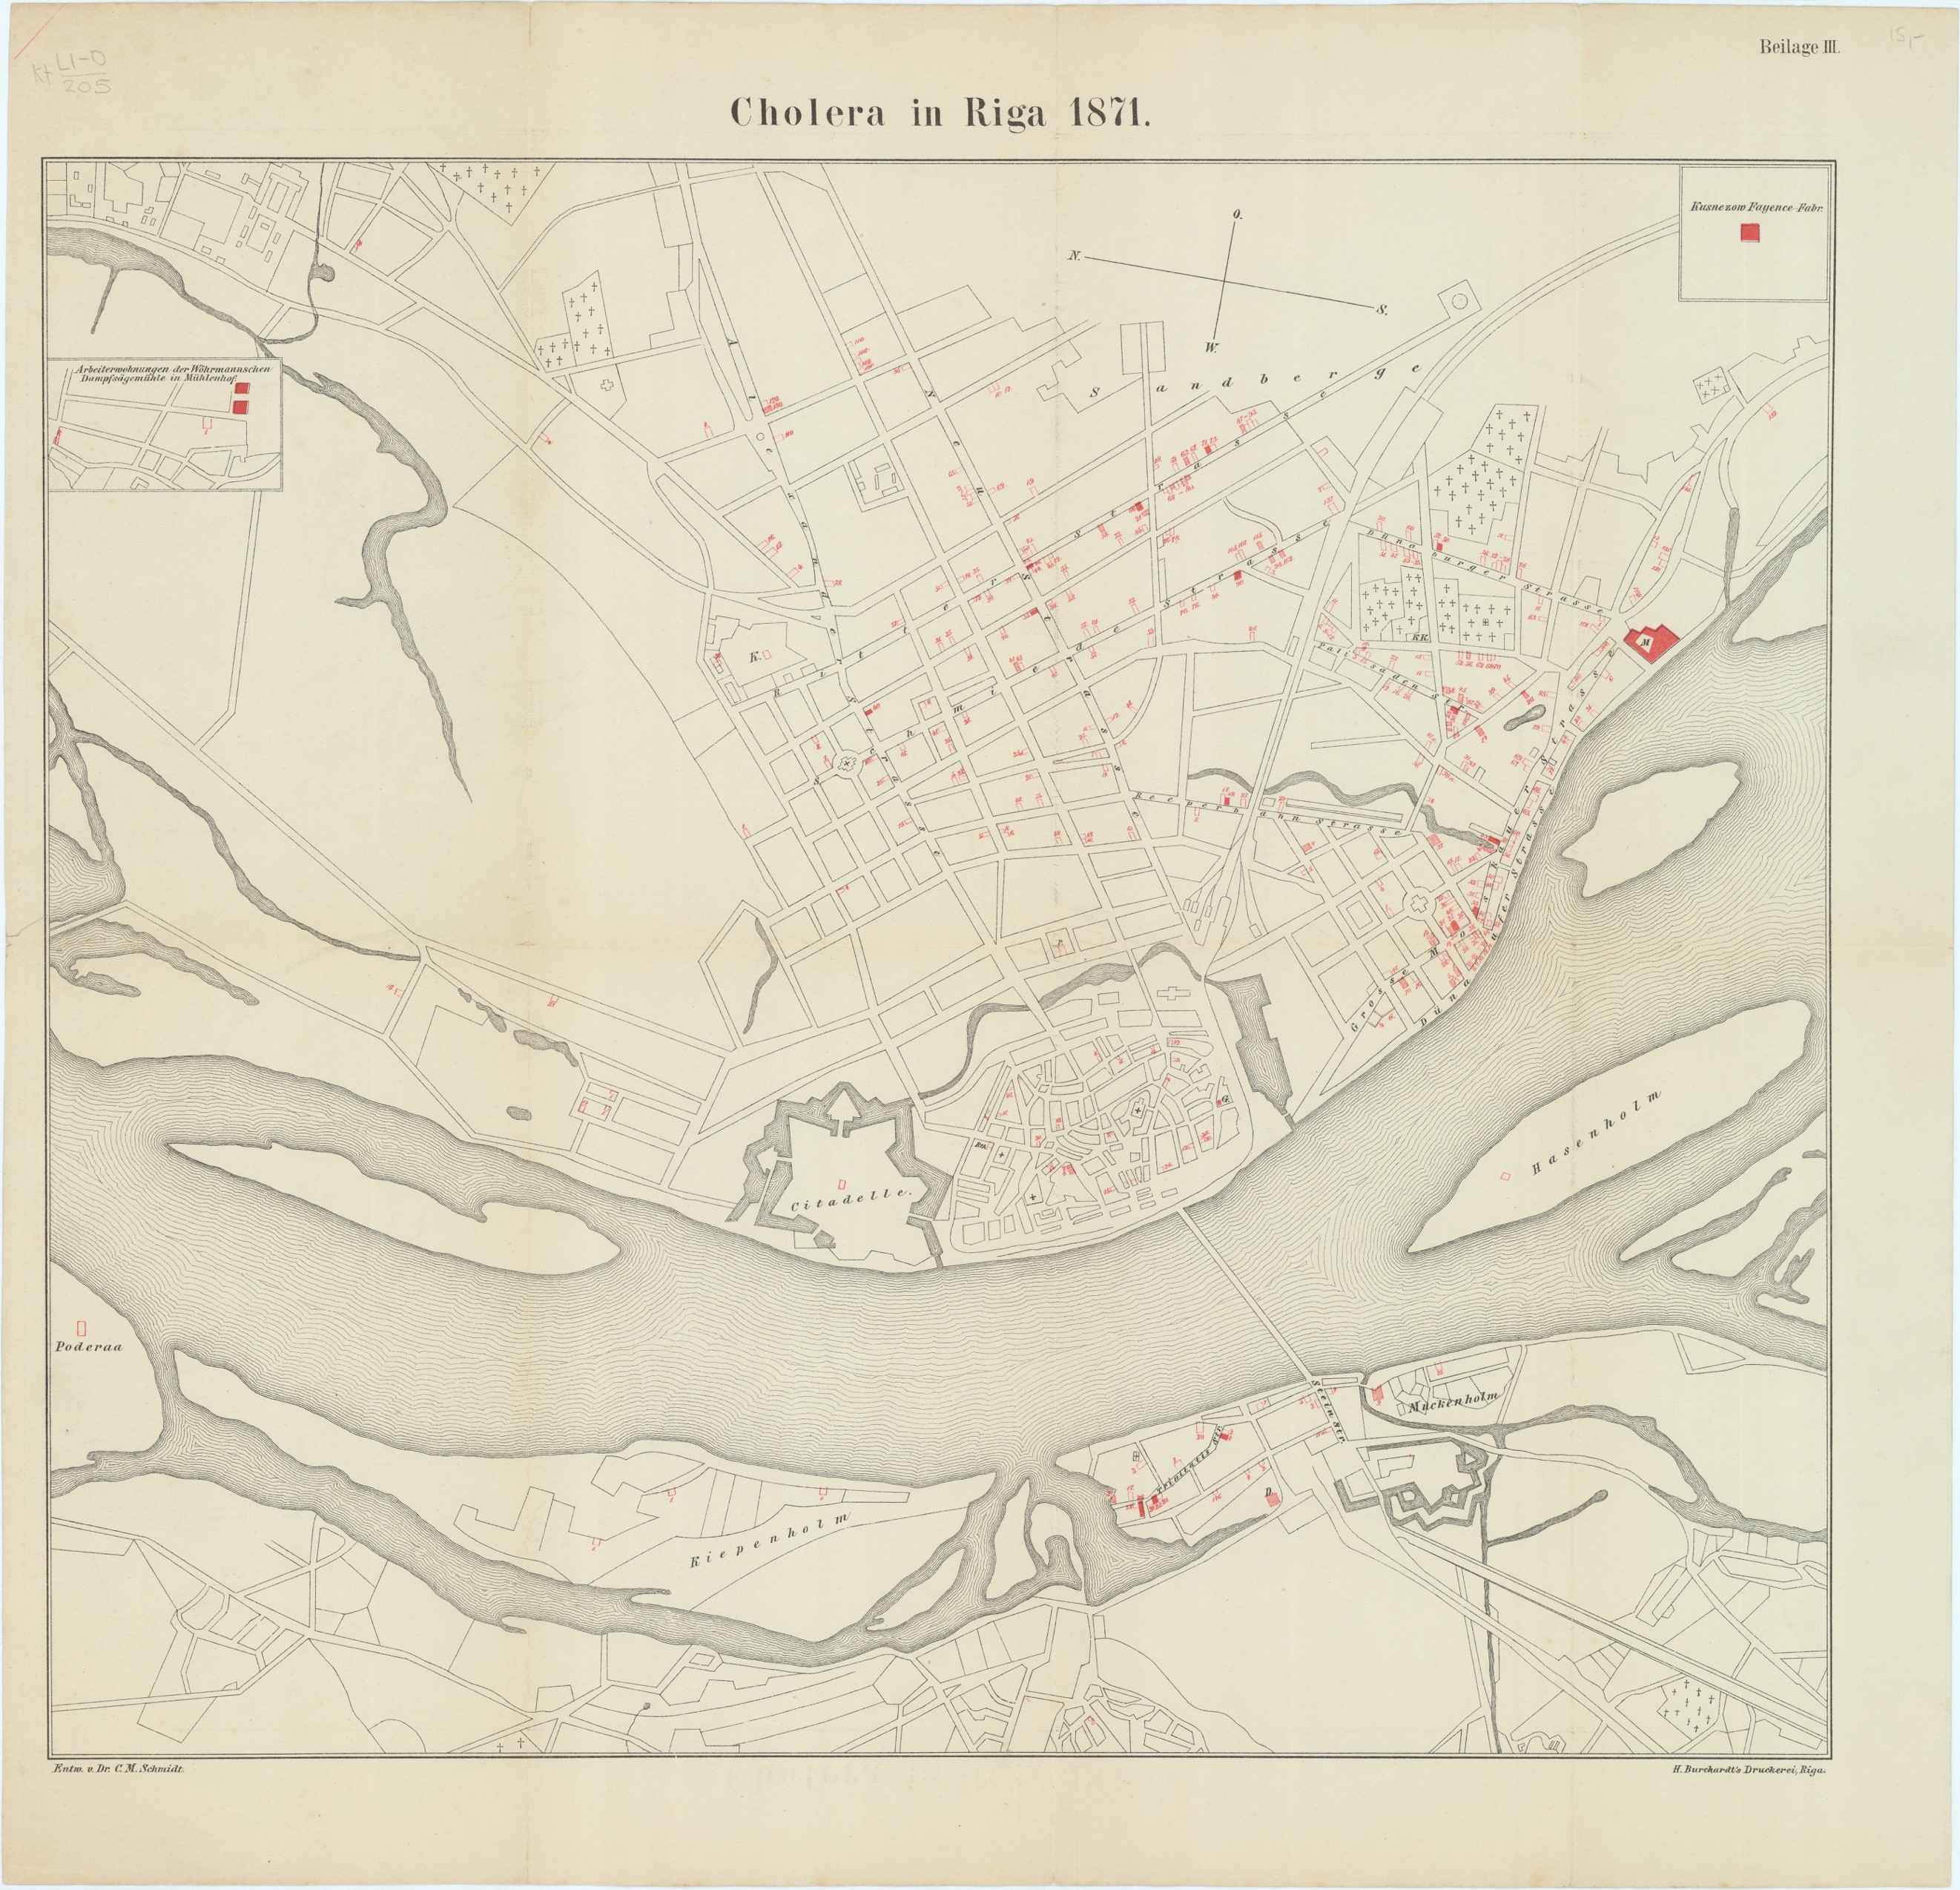
The map confirmed that the inhabitants of Riga’s Moscow suburb, situated along the banks of the River Daugava, were hardest hit by the disease, as they had been repeatedly in the earlier cholera pandemics as well. This suburb was one of the poorest areas of the city and home to mostly Russian and Jewish inhabitants. Another disproportionately affected area was the neighbourhood near the Kuznesow Porcelain Factory (highlighted in red in the map’s top right-hand corner), where workers lived in close confines in barracks. The map highlighted the coincidence between disease and poverty, showing how some groups were more vulnerable to infection as they lived in densely populated areas with poor diets. Another major contributing factor to the concentration of disease in this area was poor sanitation and unclean water from the River Daugava.
These kinds of public health maps were crucial for shaping how people understood disease as influenced both by environmental factors and social inequalities. At the same time, the possibility of creating maps that tracked individual cases at the scale of private households was only possible due to the expansion of the bureaucracy in the Russian Empire in the second half of the nineteenth century, which allowed Riga’s public health officials to engage in social surveillance at a hitherto unprecedented scale. Like today, the increasing availability of public health data also raised crucial questions about who had access to this medical data and what purpose it would be used for, and concerns about privacy. For example, during the 1881 census in Livland there were numerous reports of people in Riga who were suspicious about the motivations of the census-takers and were wary of how their data was being used by the authorities.
In method and design, the graphs and maps displayed on today’s Covid-19 digital dashboards are strikingly similar to their 19th-century paper counterparts. Ways of thinking about visualising public health that emerged two centuries ago continue shape the tools and approaches we use to track and analyse disease outbreaks in both time and space. The visual stories created through charting and mapping various disease outbreaks came to shape our understanding of disease as environmental, social, and political, as well as epidemiological. At the same time, they serve as a reminder of how many of today’s hotly debated issues – such as the ethics of data visualisation and questions about the collection and use of public health data – are not new and have been closely tied to medical data visualisation from the beginning.
1. Laura Vaughan, ‘Disease, Health, and Housing,’ in Mapping Society: The Spatial Dimensions of Social Cartography (London: UCL Press, 2018), 24-60.
2. For some 20th-century examples, see the chapter on healthcare in Eesti Rahvusatlas/The National Atlas of Estonia (Tartu: Tartu Ülikooli geograafia osakond; Regio OÜ, 2019), 267-273.
3. Carl Johann Georg Müller (ed.), Die Cholera in Riga im Jahre 1848 (Riga: Edmund Götschel, 1849).
4. Carl Schmidt, Charakteristik der epidemischen Cholera gegenüber verwandten Transsudationsanomalieen: eine physiologisch-chemische Untersuchung: mit 4 graph. Darstellungen des Ganges der Cholera und der gleichzeitigen Witterungsverhältnisse in Riga, Mitau und Dorpat. (Leipzig; Mitau: G. A. Reyher, 1850).
5. Schmidt, Charakteristik der epidemischen Cholera.
6. Carl M. Schmidt, Die Cholera-Epidemie zu Riga im Jahre 1871 nebst einem Rückblick auf die früheren Cholera-Ausbrüche daselbst; nach Zählkarten der Gesellschaft praktischer Ärzte und deren Protocollen (Riga: W.F. Häcker, 1886).
7. Schmidt, Die Cholera-Epidemie zu Riga.
8. Charlotte E. Henze, Disease, Health Care and Government in Late Imperial Russia: Life and Death on the Volga, 1823-1914 (Routledge, 2010), 1.
9. Carl M. Schmidt, Die Cholera-Epidemie zu Riga, 11.
10. Schmidt, Charakteristik der epidemischen Cholera.
The research and writing of this article was supported by the European Regional Development Fund and the program Mobilitas Pluss (Grant No. MOBJD517)
Dr. Catherine Gibson is a Mobilitass Plus research fellow at the University of Tartu in the School of Theology and Religious Studies. She is the recipient of the Association for the Advancement of Baltic Studies’ 2019-20 Emerging Scholar award and is currently writing a book on the history of ethnographic mapping in the Baltic provinces of the Russian Empire.
© Deep Baltic 2020. All rights reserved.
Like what Deep Baltic does? Please consider making a monthly donation – help support our writers and in-depth coverage of Estonia, Latvia and Lithuania. Find out more at our Patreon page.